Analysis of direct bisulfite sequencing data - (May/21/2009 )
Hello all 
About analysis of direct bisulfite sequencing!
When you get the electropherogram data by direct sequencing of PCR product,
how do you usually measure the the peak value and ratio to calculate the methylation percentage of each CpG site?
Is there a widely used software for this kind of purpose?

as far as I am aware, I don't think there is anything available that would automatically measure from a chromatogram.
you would need to manually measure the peak heights and this could be dangerous without having a standard to measure against as there are signal/noise corrections made to the chromatogram and the C or G channel (depending on your direction) could be over-corrected because of it's generally low signal compared to the other bases.
methylnick on May 22 2009, 09:42 AM said:
you would need to manually measure the peak heights and this could be dangerous without having a standard to measure against as there are signal/noise corrections made to the chromatogram and the C or G channel (depending on your direction) could be over-corrected because of it's generally low signal compared to the other bases.
Thank you, Nick!
I got that there are signal/noise corrections in generating chromatogram, but cannot think of how to make a standard.
Could you explain about this in more detail?
Thanks!!
On direct sequencing chromatograms, you can see three types of results: complete methylation (single C), no methylation (single T) and partial methylation (overlapping T and C). In the last case, you can simply measure the height of the overlapping C and T and obtain the ratio of the heights. The ratio roughly reflect the actual methylation degree. We have compared direct sequencing results with bisulfite cloning results from sequencing over 10 clones, and found this method is pretty accurate.
pcrman on May 22 2009, 12:33 PM said:
pcrman, I appreciate your reply~!
One more question!
I'm curious if I'm doing OK.
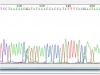
Please see the attached jpg file, it is a part of direct sequencing data of my BSP product.
I opened the abi file using Chromas, and it's read by antisense primer.
If you see the 123rd residue, overlapped A and G represent unmethylated and methylated portion of the residue.
I clicked the peaks with mouse and the software tells they are 674 and 807 by Y axis, respectively.
With the value obtained like that, methylated portion of this cytosine can be calculated as 807/(807+674) ~ 54%.
Do you think this is a proper way of measuring methylated portion?
Or how do you perform this? I don't quite understand how to measure the peak height 'manually'. Do you print out the chromatogram and measure with ruler?
Your calculation and the way of measuring the peak height is fine. Good luck with the tedious task of measuring all your peaks!
Oh, and don't bother printing it out and using a ruler, the software is more accurate that a ruler will ever be.
Thank you so much! 
Davo on May 26 2009, 07:43 AM said:
Oh, and don't bother printing it out and using a ruler, the software is more accurate that a ruler will ever be.
Hi all,
Some people, quite a lot actually, beleive that it is impossible to measure methylation level by scoring peak height on chromatograms. Even Rob Waterland, when he wants to check methylation level by direct sequencing does it "the old way" (sequencing with radioactivity, running on gels and measuring the T and C band intensity with a phosphorimager). I am new in the field but I realize that there are almost no publication showing direct sequencing and peak height scoring as a reliable method. Does it mean that reviewers reject this method or people just don't even try to publish with it ? what is your opinion about that ???
valy on Jul 23 2009, 05:09 PM said:
Some people, quite a lot actually, beleive that it is impossible to measure methylation level by scoring peak height on chromatograms. Even Rob Waterland, when he wants to check methylation level by direct sequencing does it "the old way" (sequencing with radioactivity, running on gels and measuring the T and C band intensity with a phosphorimager). I am new in the field but I realize that there are almost no publication showing direct sequencing and peak height scoring as a reliable method. Does it mean that reviewers reject this method or people just don't even try to publish with it ? what is your opinion about that ???
Hi everybody,
The problem with scoring levels is that most base calling programs (especially the standard ABI one) try to compensate for the overall low C level in your traces, blowing the overall C level out of proportion. Always check the original unprocessed traces with the base called electrogram. Some base call programs (especially the old fashioned ones) do not do this.
Furthermore, it has been published, direct sequencing. but not often.
And last but not least, there is a LINUX based program (you can easily install a virtual Ubuntu OS using VMware on your windows machines) called ESME that does the trick. ESME also corrects for the difference in in Dye intensities and does not try to blow up the C signal when base calling.
However....it is not free (#$%%^&$@$%^&^ computer nerds!!!). But it DOES work quite nicely.
Hope this post helps....
best
ET2B
Befor I forget,
Most institutes have at least one pyrosequencer or if your are lucky a SEQUENOM system.
Bot can do quantative measurements easy piecy. Pyro is best for smaller pieces of interest and few samples.
Sequenom's EPityper for 500-200bp region in large bulk >120 samples a go.
So maybe you can borrow some time on your local pyrosequencer. The commercial guys selling the pyrosequencer are very keen at getting labs buying expensive add-on software (like the methylation suite). But as a try you can do some. We just did...plan it correctly and you can do all your samples with the temporary test licence and save a lot of money...
POWER TO THE PHDS ON A TIGHT BUDGET!
best
ET2B