Strange amplification plot - (Oct/10/2011 )
Hello,
I´d like to ask you for help with my real-time PCR. We use a multicopy gene for pathogen detection. Reaction is quite sensitive, efficiency approx. 1. However, amplification plots are strange. The plateau phase is not on the same level. Standards (plasmids) have plateau on higher level than samples and the higher concentration the sample (standard) has, the higher level of plateau is detected. Sometimes the amplification curves look like a track of a comb.
Could anybody tell me why the amplification is so different in various samples? Is there any way how to improve the amplification?
Thanks a lot for your advice.
Hana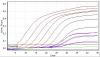
The plateau hight is not relevant as long as you have the exponential phase similar. As in your standards, you should not worry about that.
But your sample curves shows clearly different amplification efficiency too. That may be from different reasons. You didn't write any details, is it SYBR or probe assay? If it's SYBR, how does the melting curve look like? If it's probe assay, you may try it with SYBR and check the melting, unspecific amplification may cuase this. Also inhibition, that may be tested if you dilute your samples and compare runs.
Thank you for your reply.
I use Taqman probe. I´ll try to check the melting and perhabs do some optimisation (it has been done, however, I could try something else). We will see.
Inhibition was checked by internal control PCR and was not observed.
As I was going through the forum, I found another possible explanation of my problem. I use PCR product cloned in a plasmid as a standard. It is the product of the same PCR (i.e. same primers). Could that be the reason of the difference in efficiency between samples and standards? Would it help if we cloned a larger piece of sequence into plasmid?
Hana
Yes, plasmids are amplified with different efficiencies that real samples. So for using plasmid as a standard you should linearise them and mix with some dummy nucleic acid.
I prepared my standards with final concentration 20 ng/µl of E. coli 16S and 23S rRNA from Roche.
But this in my opinion looks like more than just usual efficiency difference, there seems to be a serious problem with your samples. Try it on SYBR, how will that look.