Strange RT-PCR Graph - Is this inhibition of PCR? (Mar/01/2010 )
We are bringing in new RT-PCR protocols to our lab and I have had pretty good luck save this one run. Most of my experience is in FISH, so the PCR side is a little new to me.
We were validating a new H1N1 protocol using samples from the state lab and I had one result that didn't match the state's result on the first run. It worked fine on repeated runs (re-extraction then RT-PCR). I believe this shows PCR inhibition, but I am not sure. Pre-amplification, the graph is supposed to be flat, but this has a downward slope and a late amplification curve that didn't pass the program's Ct (so it was resulted as "negative"). After a repeat the sample was strong positive which agreed with the state's results. We are using BD's software on the Cepheid Smart Cycler. Extraction was on the Qiagen QiaCube.
Any idea what could be going wrong with this one result? I want to be sure of what it is so that our techs will know to repeat the test if the curve looks like this. Thanks for the help.
-erik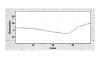
Not 100% sure. It could be any number of things, such as making the master mix wrong, wrong primer concentration, poor pipetting of the sample into the well, a PCR inhibitor etc. Did you run the qPCR in triplicate? If so, and this was the result for all three samples, it was more likely something wrong with the master mix or the presence of an inhibitor than a single pipetting error.
I wouldn't read too much into the "downward curve" that you describe. Typically there is a lot of noise in the baseline period before you get noticeable exponential amplification as the noise in the system is much larger than your signal and thus these signals don't really have any informative value.
Welcome to the world of PCR.
MM