Real-Time PCR - Gene expression (Feb/12/2010 )
Hi all
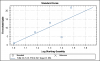
I'm doing Real-Time PCR for the first time, I started optimization of the standard curve for finding the best concentration of templet, but I faced so many problems.
for example
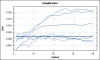
1- the amplification curve showing uneven level regarding the serial dilutions of the cDNA.
2- the CT of some amplification curves are 2.3, 4.1, 5.1 cycles, does this mean contamination or what I'm confused.
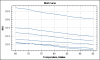
Attached you see my pcr program, amplification curve, Melting curve and melting Peak.
If any one expert have a time to look at them and feed me back, it will be very helpful for me.
thanks in advance.
Ali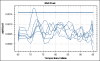
![]()
nahr on Feb 12 2010, 10:22 AM said:
I'm doing Real-Time PCR for the first time, I started optimization of the standard curve for finding the best concentration of templet, but I faced so many problems.
for example
1- the amplification curve showing uneven level regarding the serial dilutions of the cDNA.
2- the CT of some amplification curves are 2.3, 4.1, 5.1 cycles, does this mean contamination or what I'm confused.
Attached you see my pcr program, amplification curve, Melting curve and melting Peak.
If any one expert have a time to look at them and feed me back, it will be very helpful for me.
thanks in advance.
Ali
Hi Ali
First of all I'm not an expert in qPCR but still I'll try to share something. The amplification curves in your PCR result are not smooth. That points something wrong in PCR.
The Ct values are not 2.3, 4.1 etc as you have mentioned for the attached graph, I think. The Ct values are the threshold values which should be taken from exponential phase of the amplification curves.
You may guess contamination from your melting curve. If you look at melting curve, you can see many peaks. This says there are also other products along with your target amplification.
The problem may be in your cDNA sample which you have used for the standard curve formation. The primers with bad quality and the age of PCR reagents could also be the reason for the type of result you have.
Good luck with further work!
Hi I am not sure what you actually mean by uneven in your question 1. But for your question 2, can you clarify what you mean by getting different Ct? Is this on same dilution (same stock DNA) on different runs, or various Ct differences between dilutions of same magnitude? What dilution series are you using?